Reporting
Getting started
Selecting the denominator
To see how your business is doing, start by clicking on ‘reporting’ in the main navigation menu. If you do so, a list will be displayed via which you can preselect the denominator by which you want your report to be displayed. Please note you have the following options:
- Time: display your results ordered by day, by week, by month or even by year.
- Advertiser: display your results ordered by the various advertiser programs you are active for.
- Product category: display your results by the product categories the advertisers use to categorize their products. For a fashion shop, product categories could be ‘socks’, ‘shirts’, ‘shoes’, etc.; for a retailer, product categories could be ‘mobile phones’, ‘televisions’, ‘printers’, etc.
- Ad space: display your results ordered by the ad spaces via which you are generating conversions. Obviously, this only makes sense when you are working with multiple ad spaces.
- Sub ID: display your results ordered by the sub IDs you have attached to your tracking codes. For more information about sub IDs, please read this article.
- Referrer: display your results ordered by the original traffic source.
- Ad media: display your results ordered by the names and IDs of the banners, text links, HTML and Flash items you have integrated in your ad spaces.
The conversions, performance and saved filters sections have a different function that will be discussed in more detail below.
Page overview
After you have selected the denominator, a page will be displayed will be displayed looking more or less like this:

Let’s have a look at what you see at this page now. The panel above contains various options you can use to filter your report. The second panel, at the bottom of the page contains the actual report in a table.
Working with reports
How to filter your reports
The filter options allow you to differentiate your report after you have defined a main denominator. Let’s go through all the options:
- First, you can specify the time frame of your report. By default, a report will be generated containing all the conversions you generated during the last seven days. You can select another dynamic time frame, such as the day before, the current week or the last month. Use the custom time frame for a more specific time frame.
- The moment, right below the time frame option, allows you to display your conversions by the moment they were originally registered, by the date on which they were updated or by the date on which they were paid out, i.e. included in a payment entry. By default, the moment of registration will be selected.
- If you selected ‘time’ as your main denominator, you might want to define via ‘output unit’ whether your conversions should be displayed by day, week, month, quarter or year. By default, ‘day’ will be selected.
- On the right, you will find you can filter out conversions related to specific countries, advertisers, product categories, conversion targets and ad spaces.
If you are done with your filter settings, click on the button ‘show’. You can use the ‘reset’ button anytime to set back the filter settings to the default mode. If you need to use a specific combination of filter settings regularly, you can save your filter settings by clicking the ‘save filter’ button. To select the saved filter, click on the ‘saved filters’ under ‘reporting’ in the navigation menu on the left.
Report content
Getting started
Let’s have a closer look at the actual report now:

As you can see, the denominator of this report is time and the unit of output is day. You can see the table contains three main columns: traffic, conversion and total. Let’s go through all of them.
Traffic column
The traffic column contains the following elements:
- The number of views you generated, i.e. the number of times an ad media item was displayed on one of your ad spaces. By clicking on the plus icon, you can display the number of views for which commission was granted. Please note you will only generate commissions with views when the advertiser you are generating conversions for is working with a commission model rewarding views. Most advertiser’s work on a cost per action (CPA) based model, which only rewards the actual conversions you generate.
- The number of clicks you generated, i.e. the number of times a potential customer clicked on an ad media item. By clicking on the plus icon, you can display the number of clicks for which commission was granted. Please note you will only generate commissions with clicks when the advertiser you are generating conversions for is working with a commission model rewarding clicks.
- The so called click-through-rate (CTR), i.e. the percentage of views that resulted into clicks.
- And finally, the amount of commission you generated with views and clicks. By clicking on the plus icon, you can display the amount of commission specified for views and clicks.
Conversion column
The conversion column contains the following elements:
- Under ‘number’, you will find the number of conversions you have generated. This number includes all commercial conversions, i.e. actual commercial events on the website of the advertiser. It does not include other conversions, such as a potential customer going to a product page, putting an item in the shopping basket, etc. For more information, please read this article. By clicking on the plus icon, you can differentiate the conversions by post-click and post-view conversions. Post-view conversions are conversions generated without a potential customer clicking on an ad media item. Please read this article for more information on post-view tracking.
- Under ‘revenue’, the amount of revenue related to the conversions will be displayed. Via the plus icon you can differentiate the revenue in post-click and post-view conversions.
- Under ‘commission’, you will find the amount of commission attributed to the conversions you generated. Again, the plus icon allows you to differentiate the commission in in post-click and post-view conversions.
- The conversion rate (CONV) is the percentage of clicks that resulted in conversions.
- The confirmation rate (COFN) is the percentage of conversions that is confirmed by the advertiser. Some conversions are confirmed, other conversions are rejected, for example because a customer canceled the order. For more information on the validation of conversions, please read this article.
Total
The figure you see under ‘total’ represents the total amount of commission you have generated in ordered by the selected denominator. Please note the figures you see here can include commission generated for views, clicks and conversions.
Report handling
Sorting your report
Suppose you have created an overview of all the conversions you have generated last week. And now you want to see what were the best days and what were the worst. To do this, go over the slim grey bar with your mouse: little arrows will appear allowing you to sort by the column you have selected, starting either with the lowest value (click on ˆ) or the highest (click on ˇ), more or less as in the following image:

Of course, the other columns will be reordered as well. This function also comes in handy when you want to see what the best performing ad media items are, what advertiser programs are converting best on your ad spaces, etc.
Confirmed and rejected conversions
When the advertiser has validated your conversions, you will be able to differentiate the number of conversions, the revenue and the commission. All you need to do is click on the arrow pointing down next to the relevant figure. When you do this, a panel will appear looking more or less like this:

The figures marked with the yellow circle represent the open conversions, the red cross represent the rejected ones, the green check the confirmed.
Exporting reports
To export your report, use the little icons at the bottom of the page:
 As export format, you can choose between XLS, CSV and XML. More details on exporting data from your partner UI can be found in this article.
Reporting accuracy
Views and clicks are updated every hour. A conversion will be visible approximately 15 minutes after it was tracked.
Conversions
For more details on the conversions you have generated, click on conversions in the navigation menu. If you do so, a page will appear that, much like the main reporting page, has consists of two panels: a filter panel and a panel containing your conversions. The filter panel basically works in the same way the filter panel on the reporting page works. Please note that in the default mode, the filter panel will contain all your ad spaces.
Let’s have closer look at an individual conversion now: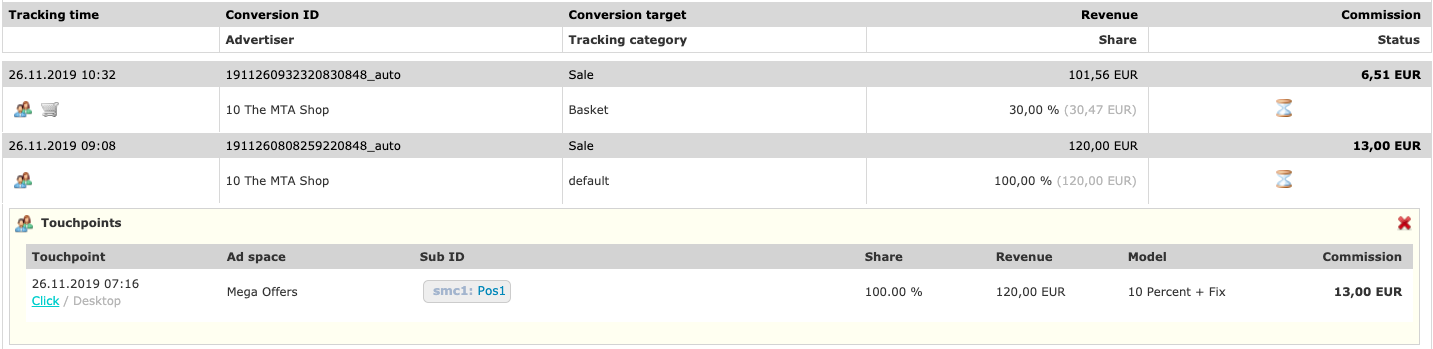
This panel element contains all the data related to your conversion. We will go through them one by one, working our way through the sections from the left to the right and from the top of the section to the bottom:
- In the left top corner, you will find the time and date on which the conversion was tracked. Please note the time zone used here UTC+1 in winter and UTC+2 in summer.
Further below in the section, you will find at least one icon:- If you click on the icon
 , you will find the touchpoint information of the conversion: the request time of the touchpoint (i.e. the time on which the click or view was generated), the indication whether the conversion is a post click conversion (Click) or a post view conversion (View), the device, the ad space name, the sub IDs, the percentage share and the shared revenue of the touchpoint, the commission model and the shared commission of the touchpoint
Please be aware, that in case the advertiser offers the shared commission it is possible that you can see less than 100% of the revenue. Depending on the attribution model applied, one or more touchpoints can be assigned to you. - If you click on the Click / View indication you will find also the information of used ad media and the referrer.
- When the advertiser you have generated the conversion for is using basket tracking, you will also find the
 icon. If you click on this icon, a small panel will appear containing all the basket data related to the conversion.
 - If a voucher was involved in the conversion, you will find all data related to it if you scroll over the
 icon.
icon.
- If you click on the icon
- In the next section, you will find the conversion ID and the name of the advertiser.
- In the third section you will find the conversion target name of the conversion. The conversion target can be a ‘purchase’ or an ‘order’, but it can also be a ‘subscription’. The most common conversion target types are leads, sales, click-ins and engagements. Below the conversion target, you will find the tracking category of the conversion. Please note, the tracking category will always be ‘basket’ when the advertiser you have generated the conversion for is using basket tracking.
- In the fourth section, you will find the total revenue of the conversion. Below you will find the percentage share (and the shared revenue) of the conversion that applies to you. This share can be between 100% or less than 1% and is the basis of your commission.
- In the last section, you will find the commission assigned to the conversion and the status. Please note there are four different statuses:
- The
 indicates your conversion is open, i.e. waiting for approval.
 - The
 indicates your conversion has been approved. This means the advertiser has confirmed the order was processed and there were no irregularities found.
 - The
 indicates your conversion has been canceled. This means the customer has sent the order back or the advertiser has found irregularities in the conversion.
 - The
 indicates your conversion has been confirmed. This means the advertiser has approved the budget for the commission.
- The